Bookkeeping Fundamentals
Chart of Accounts for Small Business: A Thinking Tool
May 25, 2026
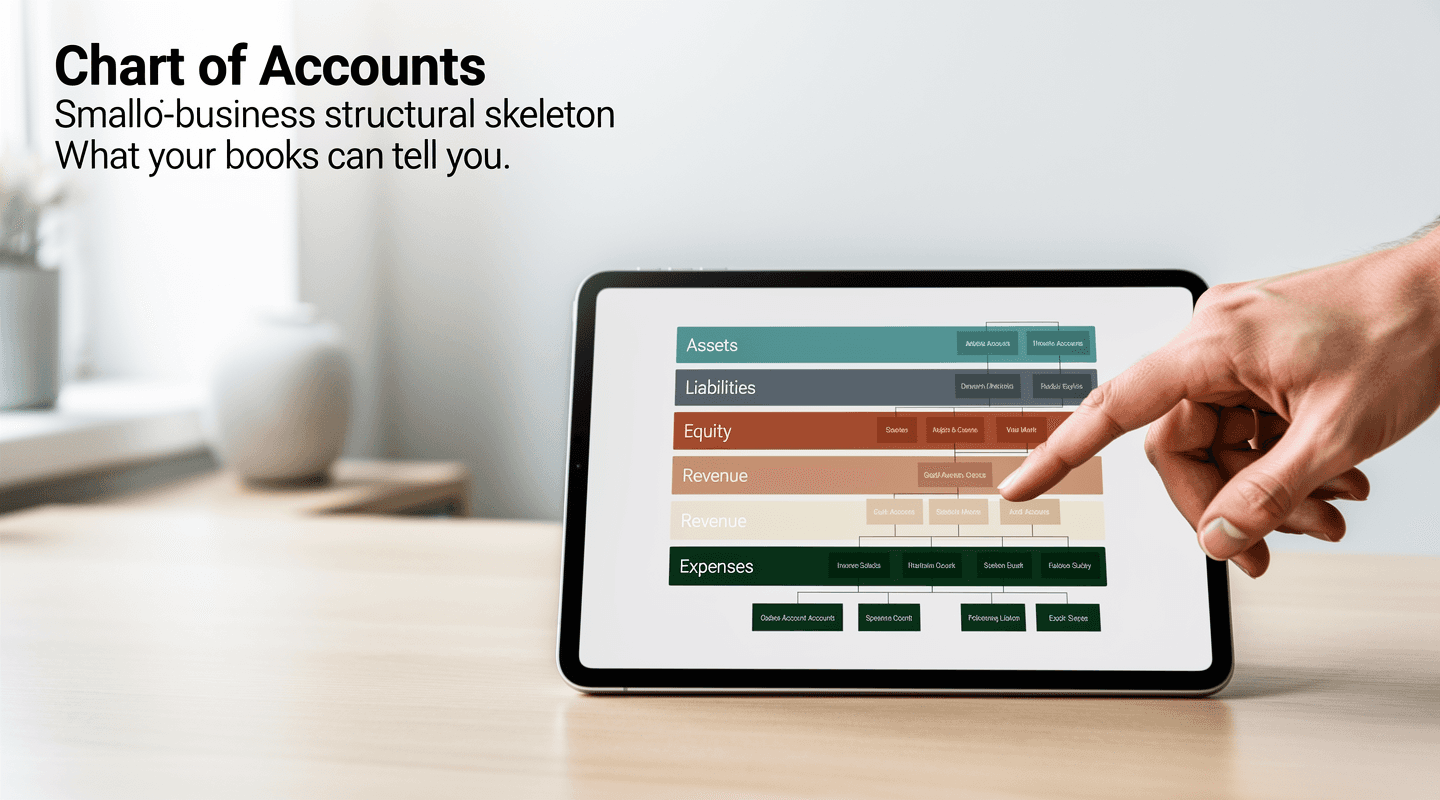
Your bookkeeper opened QuickBooks and showed you the chart of accounts. There are 240 lines. Half of them have been used once. A third have a zero balance. The rest you don't recognize. This is the chart of accounts that nobody has been thinking about — and that's the problem.
This post covers what a chart of accounts actually is, why most small-business COAs are too granular, what good defaults look like by industry, and how to clean up a COA that's drifted over time.
Key takeaways
A chart of accounts is the structured list of every account your business uses to record transactions. It's not just a configuration in your bookkeeping software — it's the structure of what your books can tell you.
Every COA has five top-level categories: Assets, Liabilities, Equity, Revenue, Expenses. Everything else is a sub-account inside one of those five.
Too granular is the more common failure mode, not too coarse. A 60-line COA with the right structure beats a 240-line COA where half the accounts have one transaction each.
Industry matters. A service business, an e-commerce shop, an agency, and a rental property holding company all want different defaults. Don't import a generic template.
Adding an account should require a real reason. The bar is: "I'd want to see this line separately on the P&L or balance sheet." If you can't say yes, the transaction probably belongs in an existing account.
What a chart of accounts actually is
A chart of accounts (COA) is the structured list of every account your business uses to record transactions. Every time the bookkeeper or the bank feed posts a transaction, it lands in one of these accounts. The COA defines:
What gets tracked separately
What gets lumped together
How the P&L is structured (revenue lines, expense categories)
How the balance sheet is structured (asset, liability, equity categories)
Most owners think of the COA as a configuration screen in QuickBooks or Xero. It's more important than that. The COA is the shape of your financial reporting — if there's no "Cost of goods sold" account, you can't measure gross margin; if marketing is split into eight sub-accounts and rent is one line, your P&L tells you one thing in detail and the other in summary.
Good bookkeeping starts with a COA that gives you signal at the right level of detail. (Modern Axis's bookkeeping basics piece is the broader primer if you're starting from scratch; our reading-the-balance-sheet post covers how the asset, liability, and equity sections of the COA flow into the balance sheet you review monthly.)
The five top-level categories
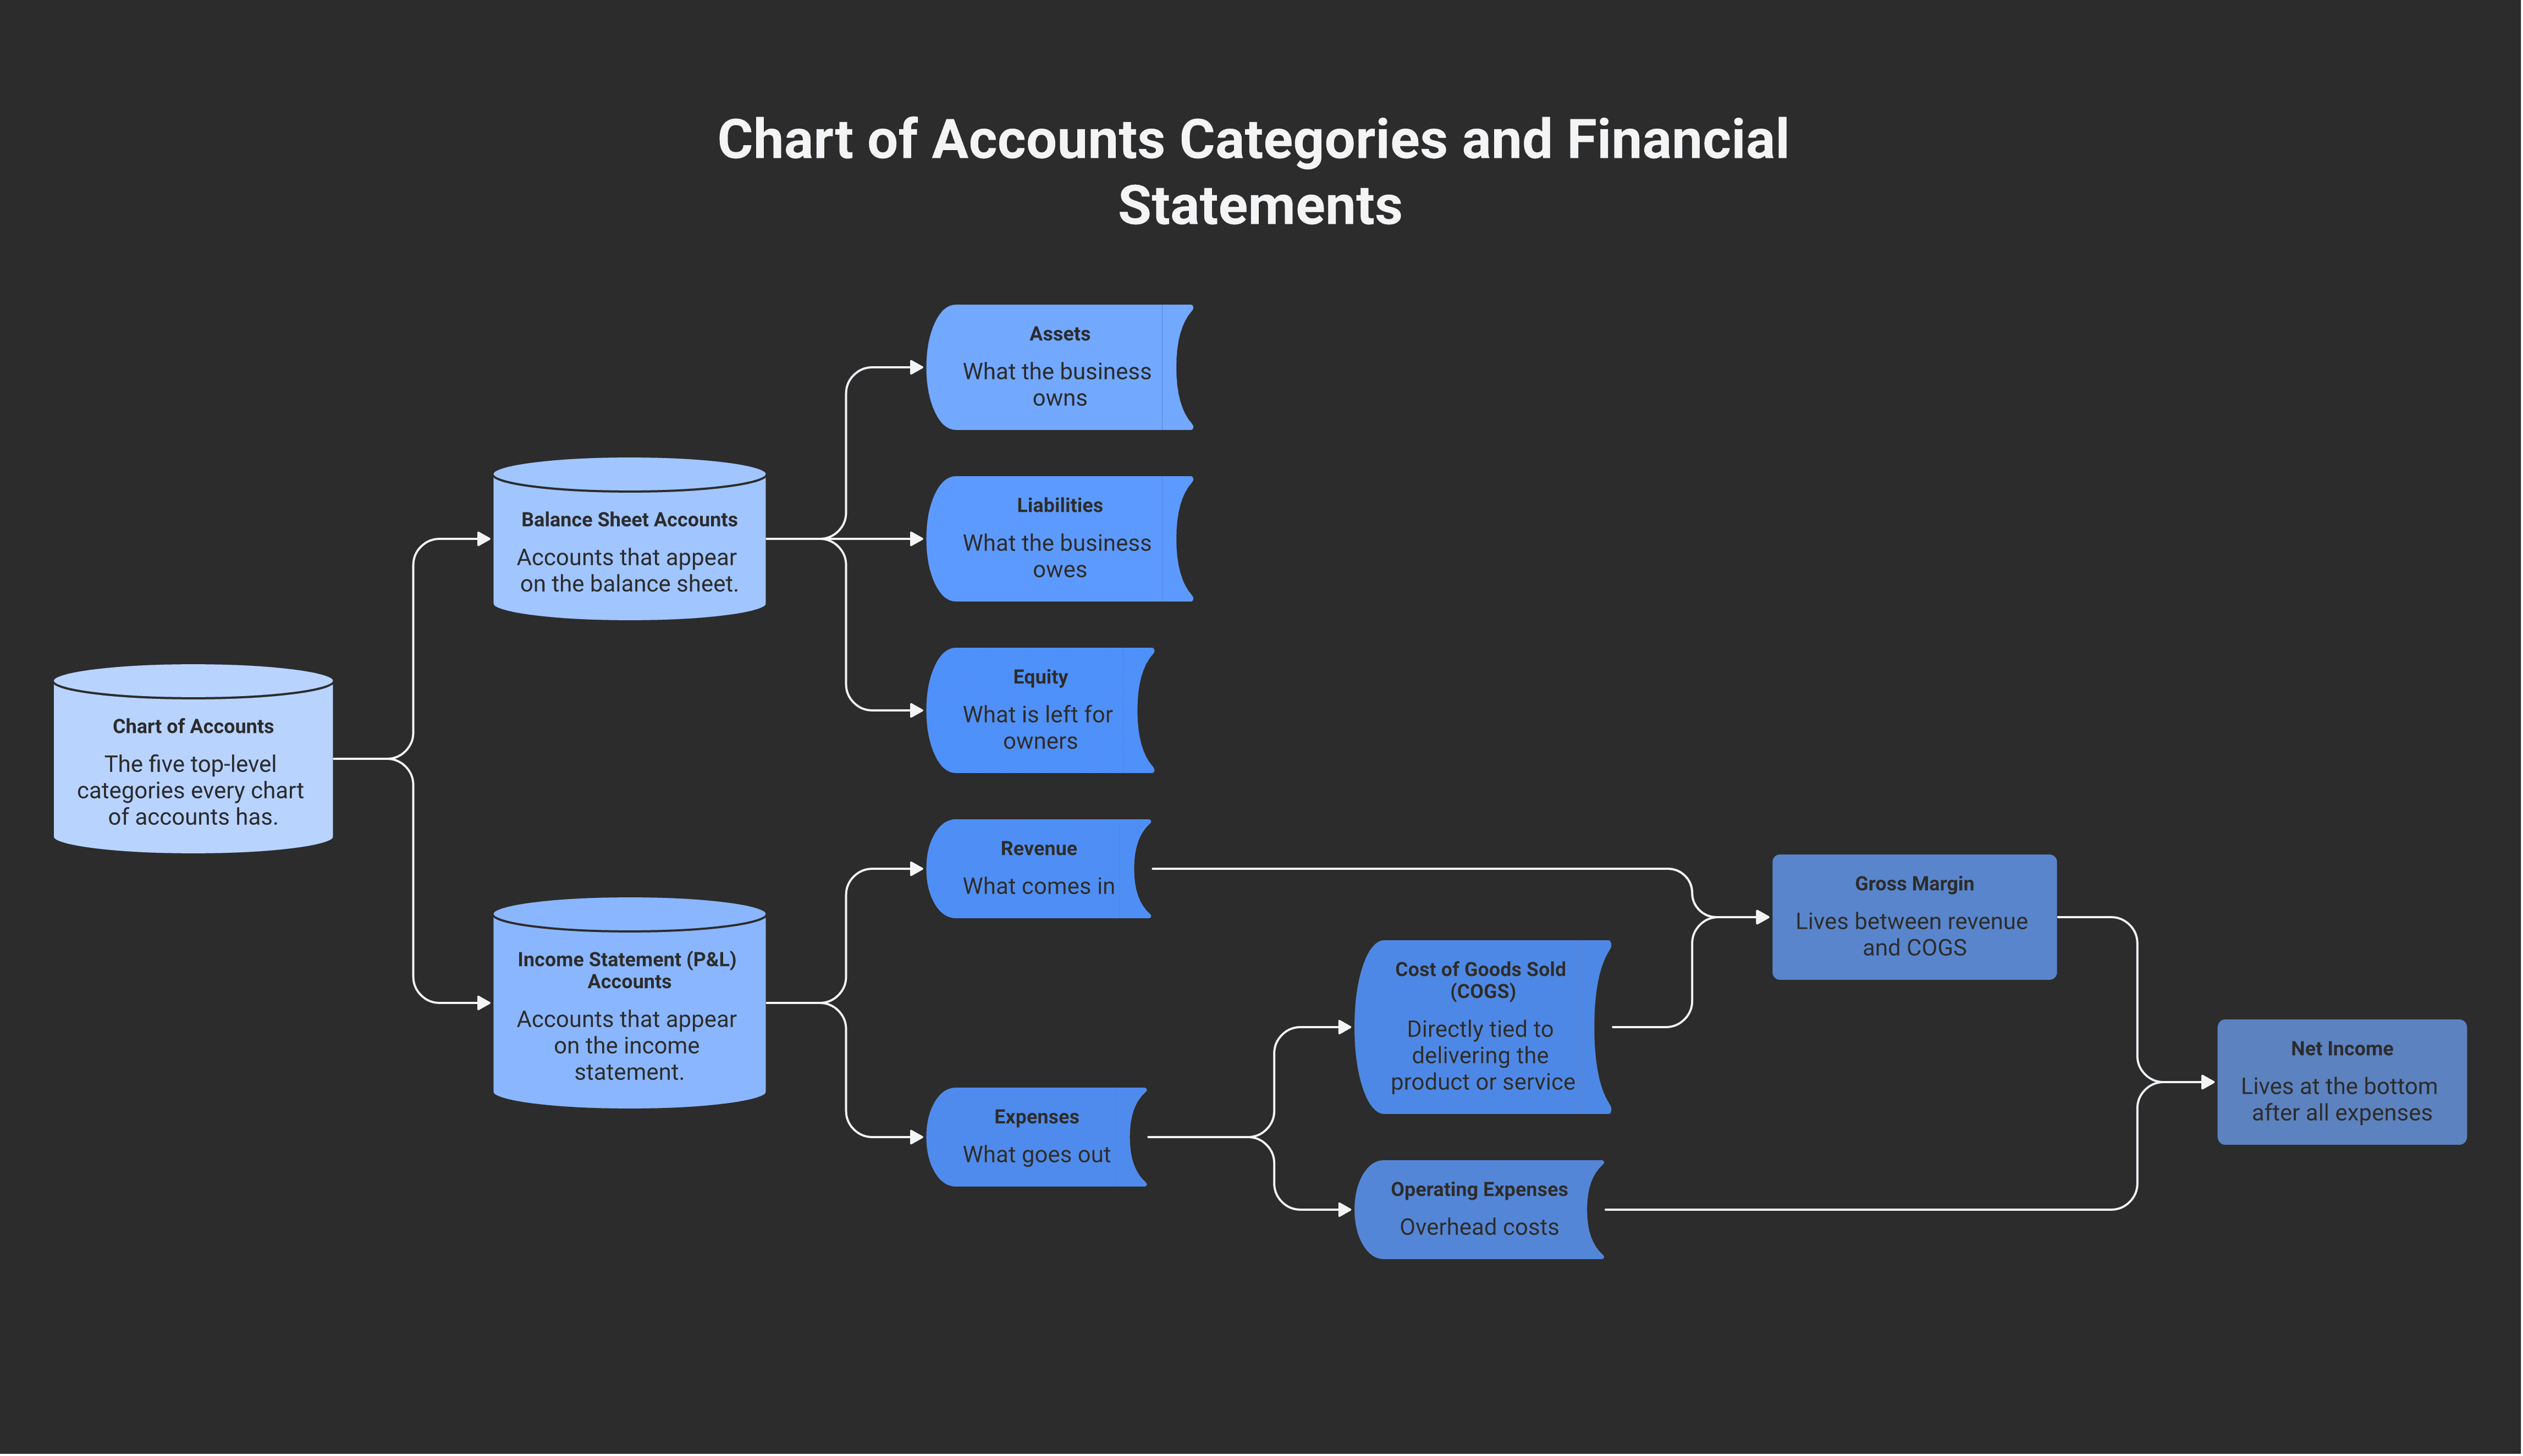
Every COA, in every software, in every country, has the same five top-level categories. They map to the two financial statements:
Balance sheet accounts:
Assets (what the business owns)
Liabilities (what the business owes)
Equity (what's left for the owners)
Income statement (P&L) accounts:
Revenue (what comes in)
Expenses (what goes out)
Some COAs split expenses into two: Cost of goods sold (COGS — directly tied to delivering the product or service) and Operating expenses (overhead, indirect costs). Gross margin lives between revenue and COGS; net income lives at the bottom after all expenses.
Every account in your COA is a sub-account inside one of those five. The structure of the COA is the structure of what your books can tell you about the business.
Numbering conventions
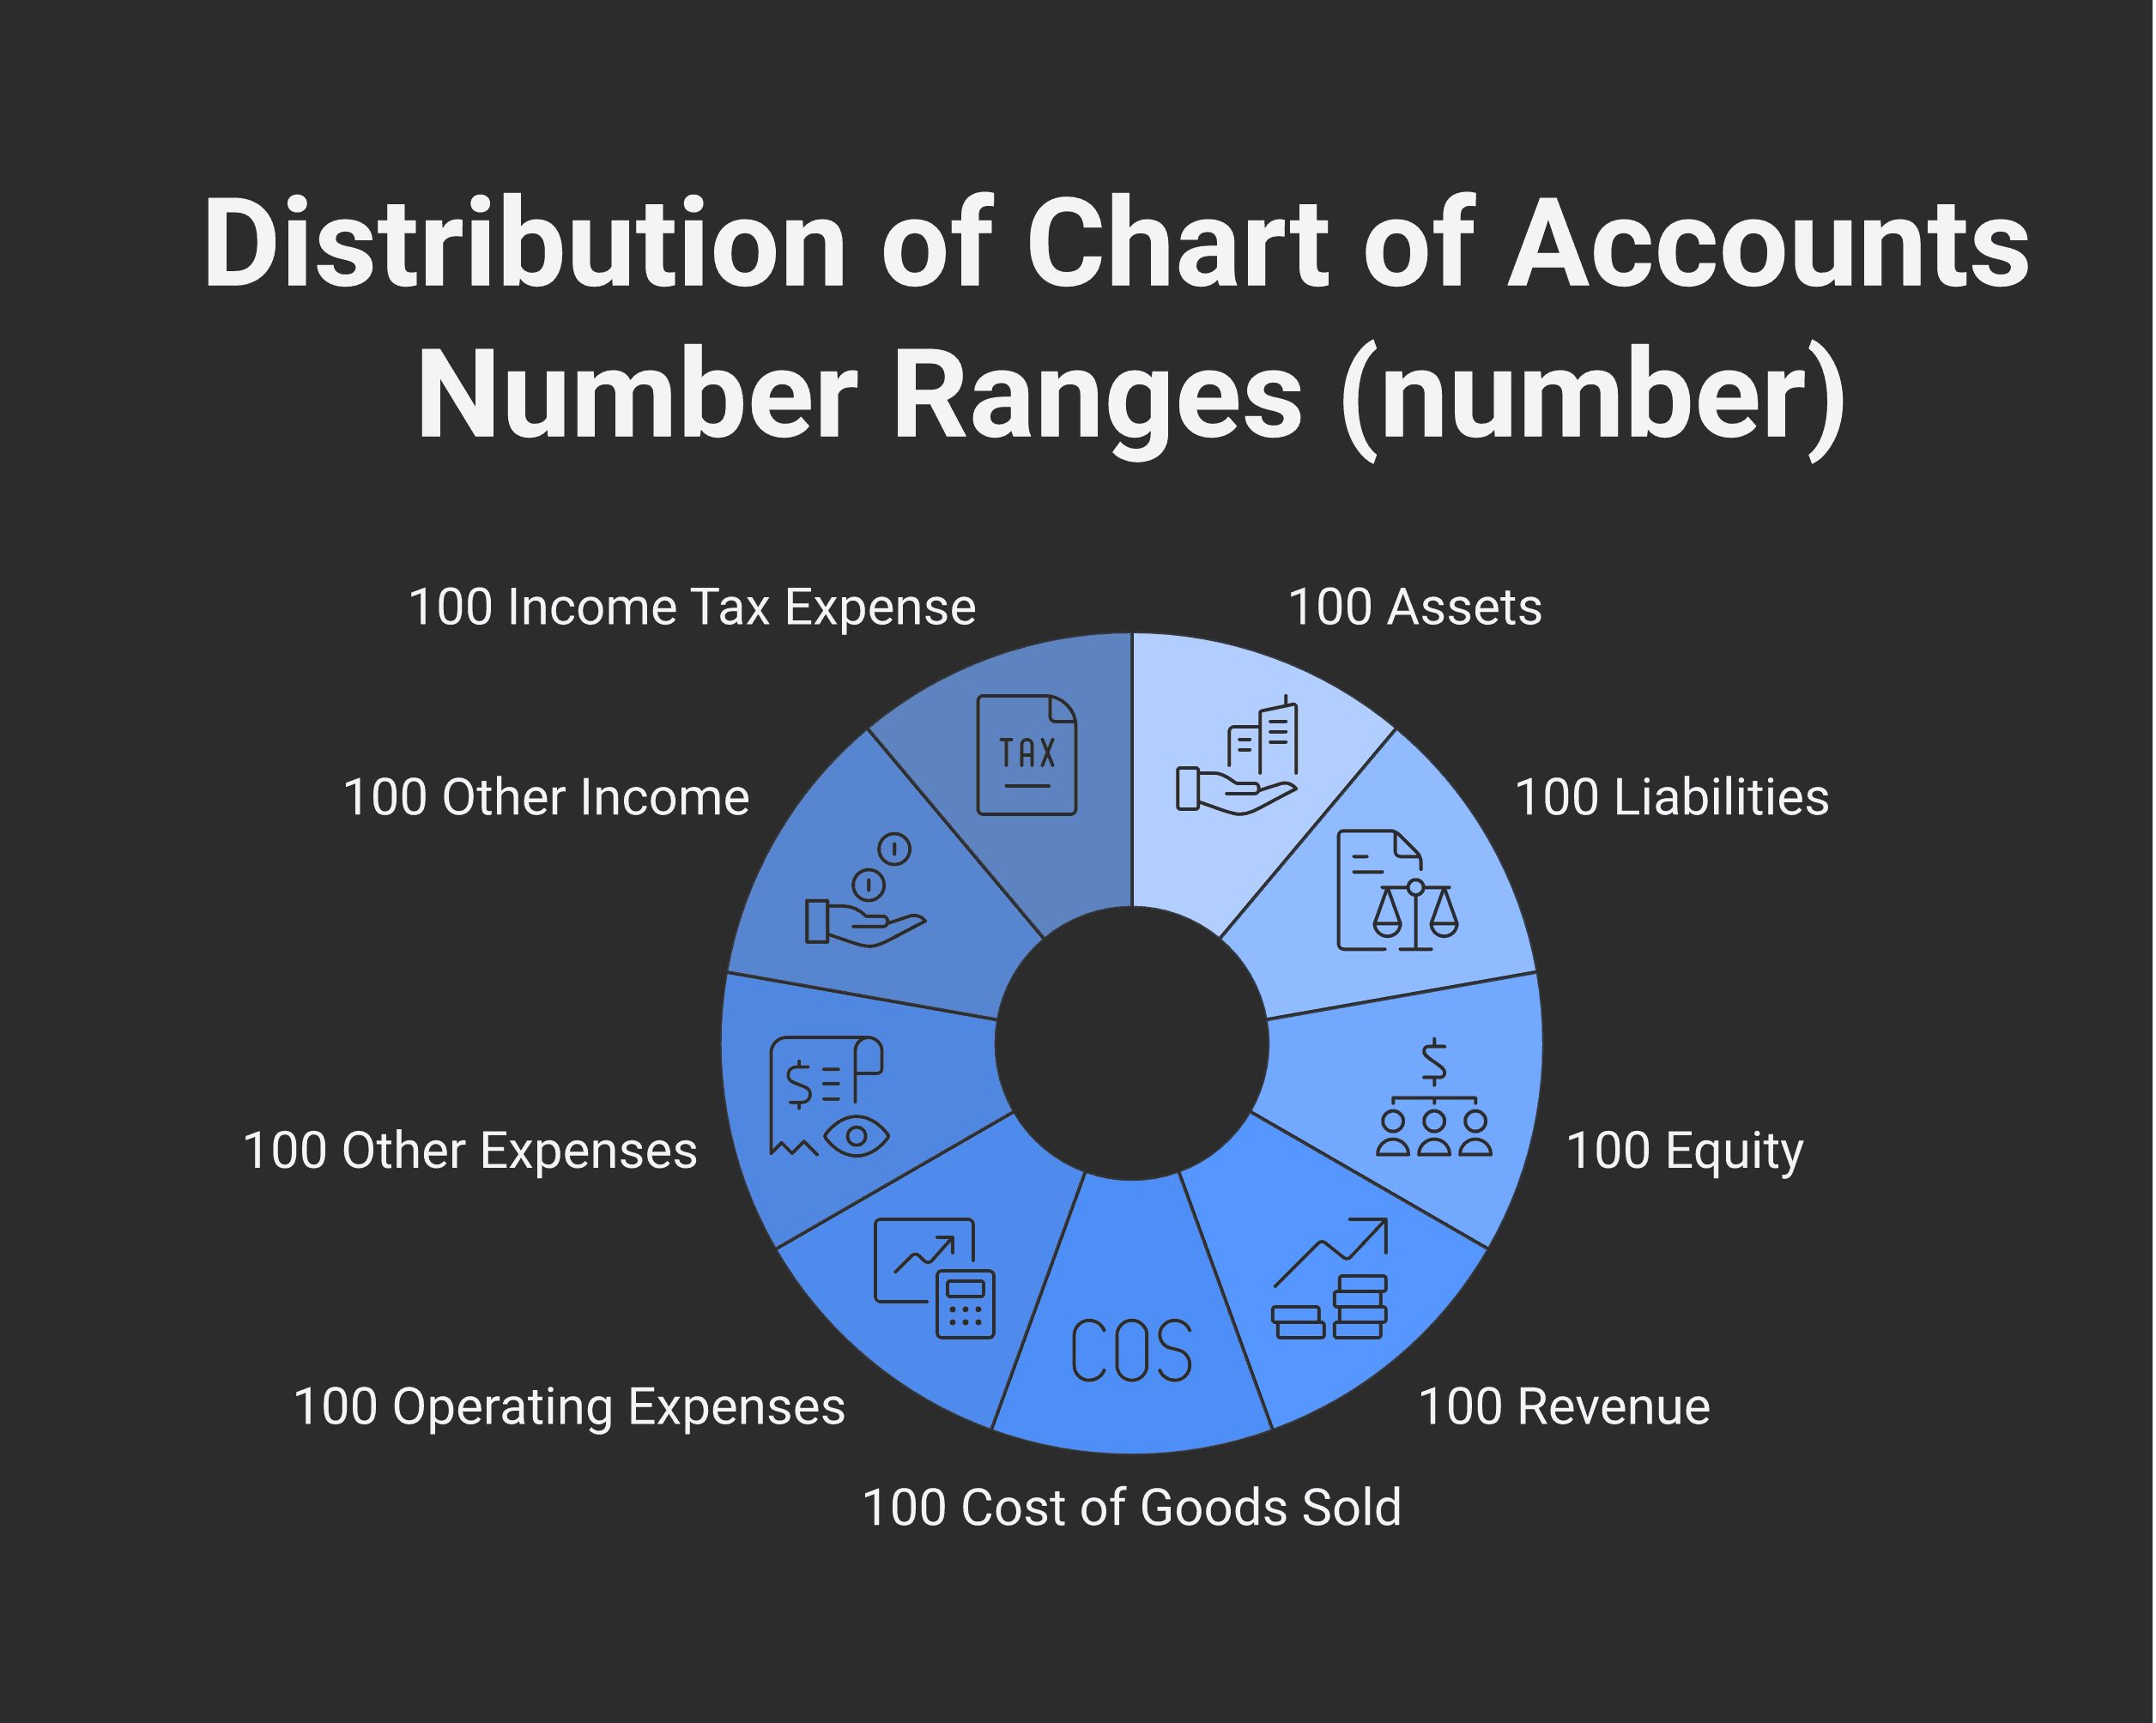
Most bookkeeping software uses a four-digit account-number system to organize the COA. The convention isn't required, but it's universal enough that ignoring it makes the books harder to read:
Range | Category |
|---|---|
1000–1999 | Assets |
2000–2999 | Liabilities |
3000–3999 | Equity |
4000–4999 | Revenue |
5000–5999 | Cost of goods sold |
6000–6999 | Operating expenses |
7000–7999 | Other expenses (interest, depreciation, amortization) |
8000–8999 | Other income (interest income, gain on sale) |
9000–9999 | Income tax expense (corporate only) |
Sub-accounts use the same range — 1100 Bank — operating, 1110 Bank — savings, 1120 Bank — USD operating. The number tells you the category at a glance.
A COA that doesn't follow this convention isn't wrong; it's just harder for any new bookkeeper or accountant to read. If you're starting fresh, follow it.
Why most COAs are too granular
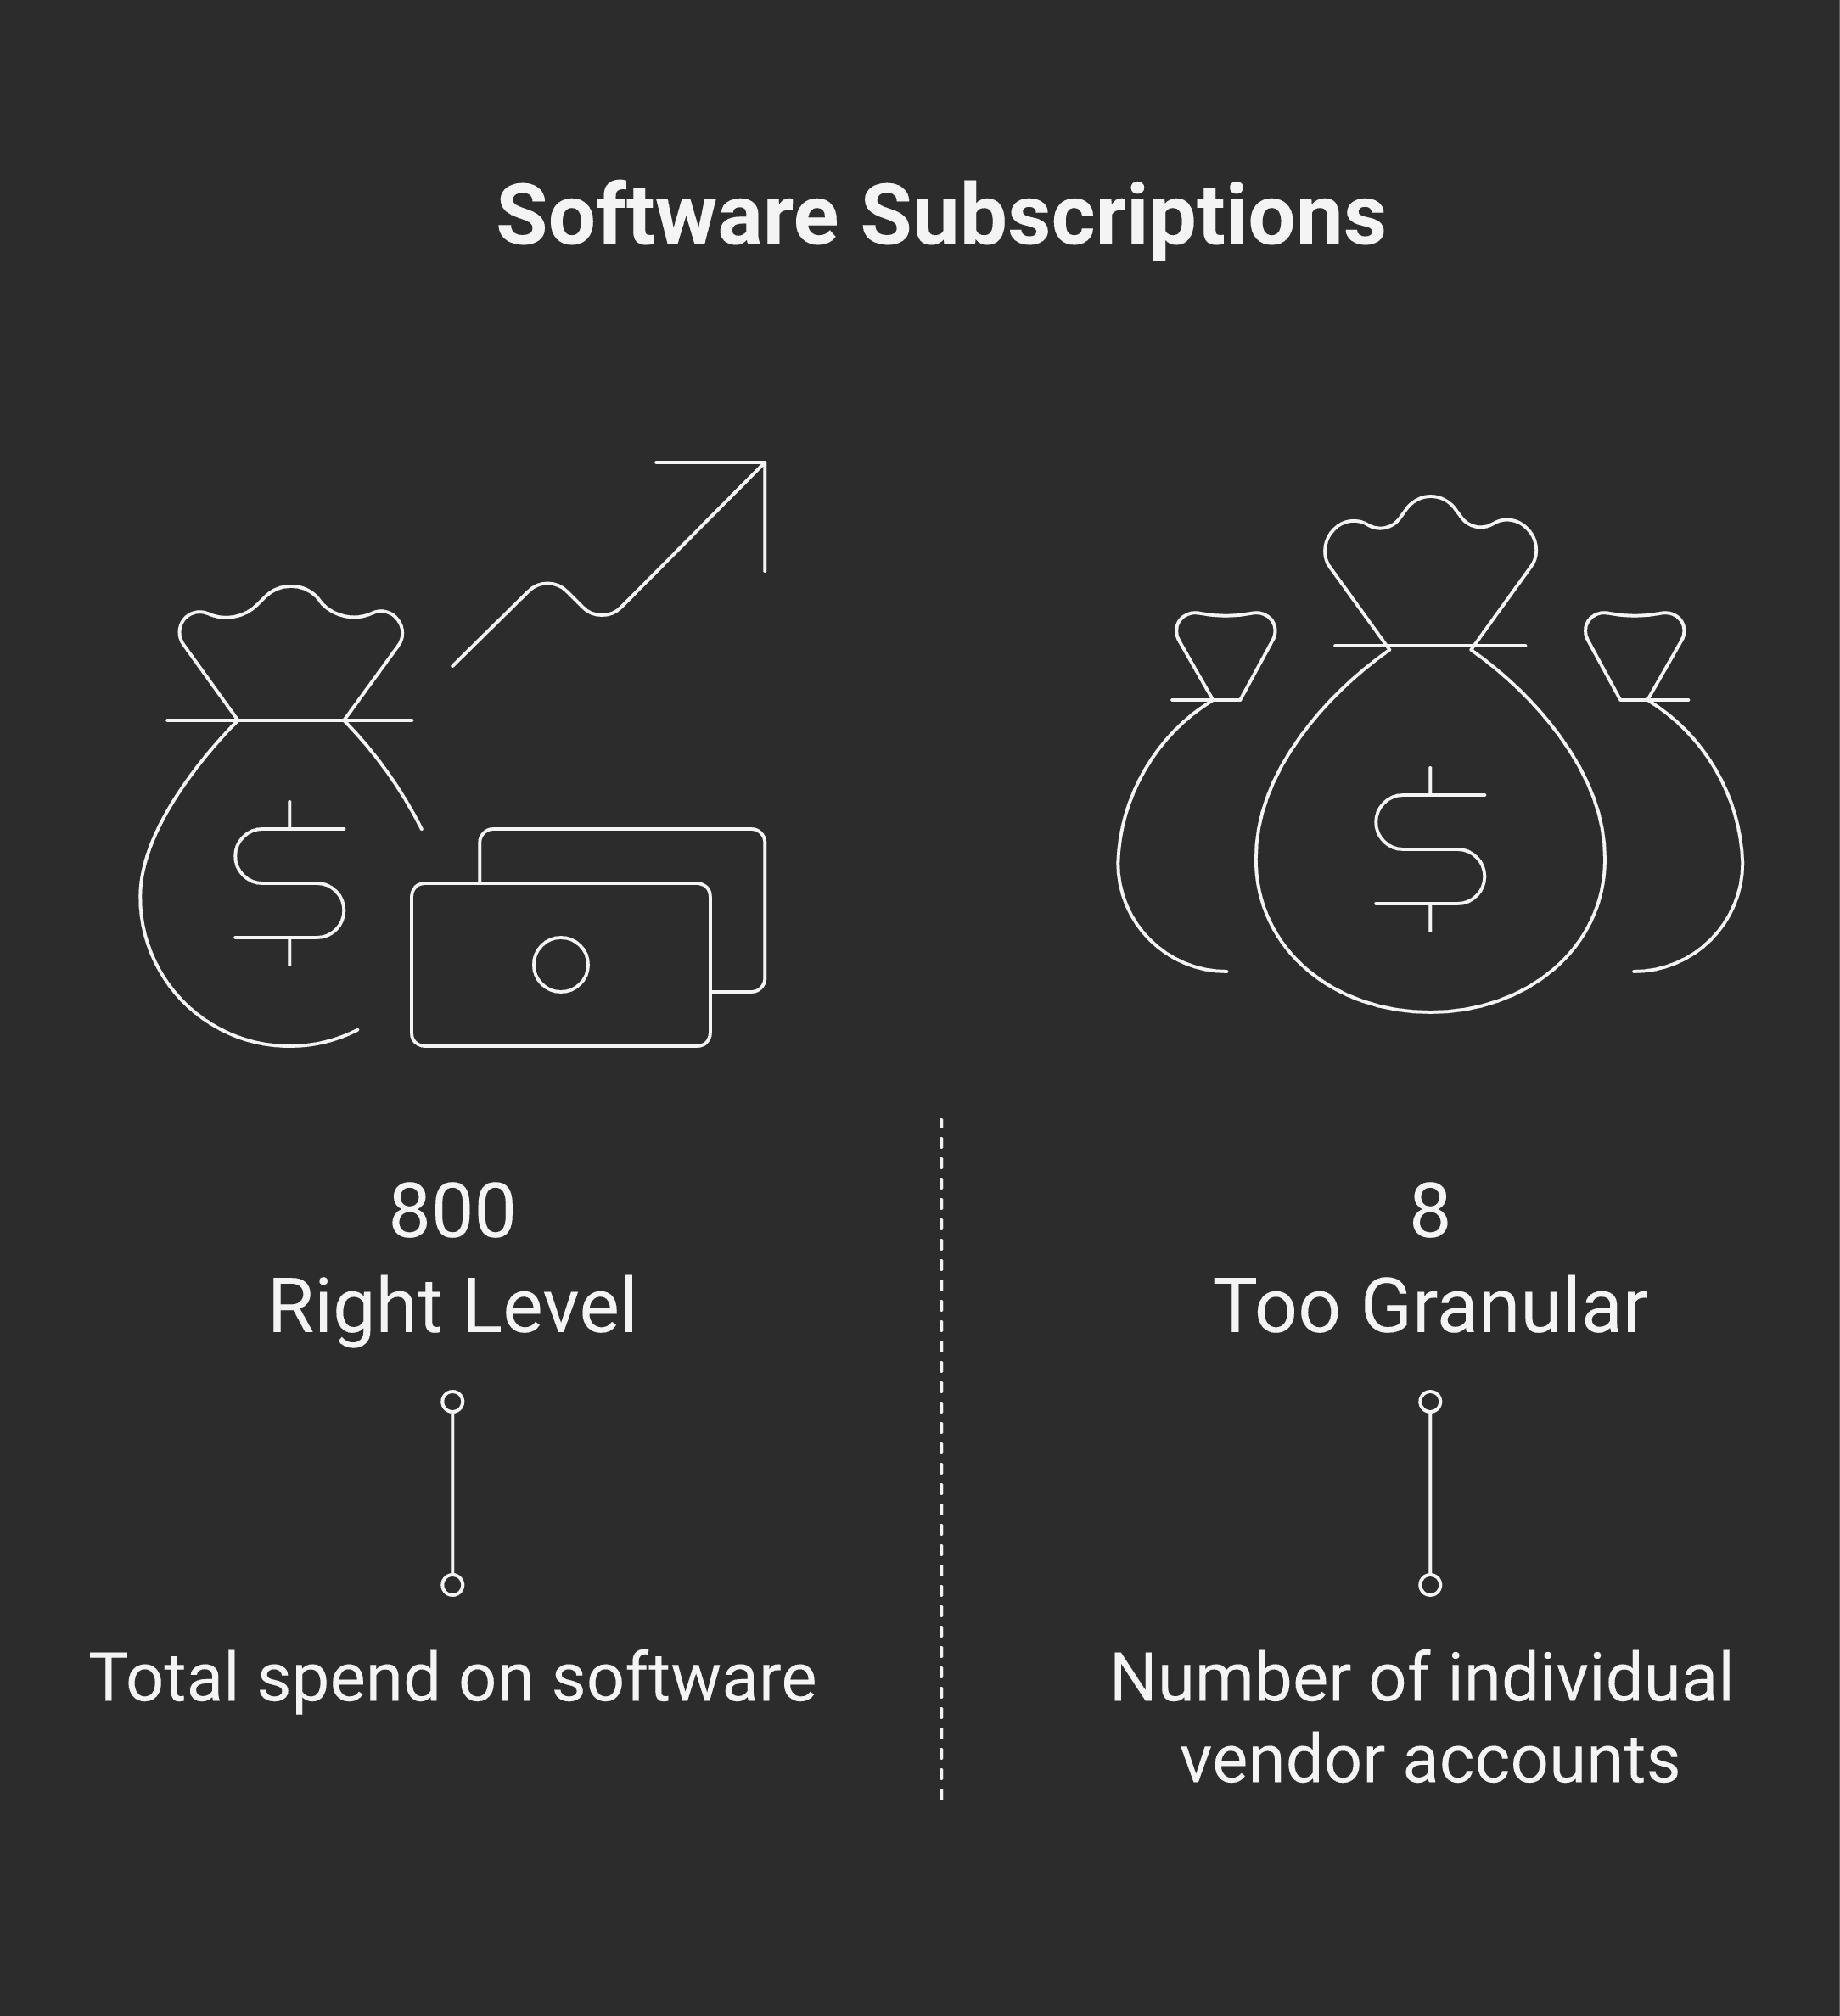
The single most common COA problem on DIY books is too many accounts, not too few. A typical drift:
The owner installed QuickBooks 18 months ago and accepted the default COA (about 60 accounts).
Over time, every time a new vendor's bill came in, the owner created a new account: "Adobe subscription", "Canva subscription", "Zoom subscription", "Figma subscription".
A year later, those four are each one-line accounts that should have been "Software subscriptions".
"Office supplies" is now split into "Office supplies — printer ink", "Office supplies — paper", "Office supplies — pens".
The expense section is 80 lines deep, and the P&L doesn't tell you what you spent on software, only what you spent on each piece of software.
The bar for an account is: I'd want to see this separately on the P&L. If you can't say yes — if you'd lump it back into a parent category at year-end anyway — the account doesn't earn its place.
A 60-line COA with the right structure tells you more than a 240-line COA where every vendor is its own account. The cleanup work to consolidate a sprawling COA is straightforward but tedious — and it usually surfaces at the year-end close, when the accountant asks why "Adobe subscription" needs its own line.
Industry defaults
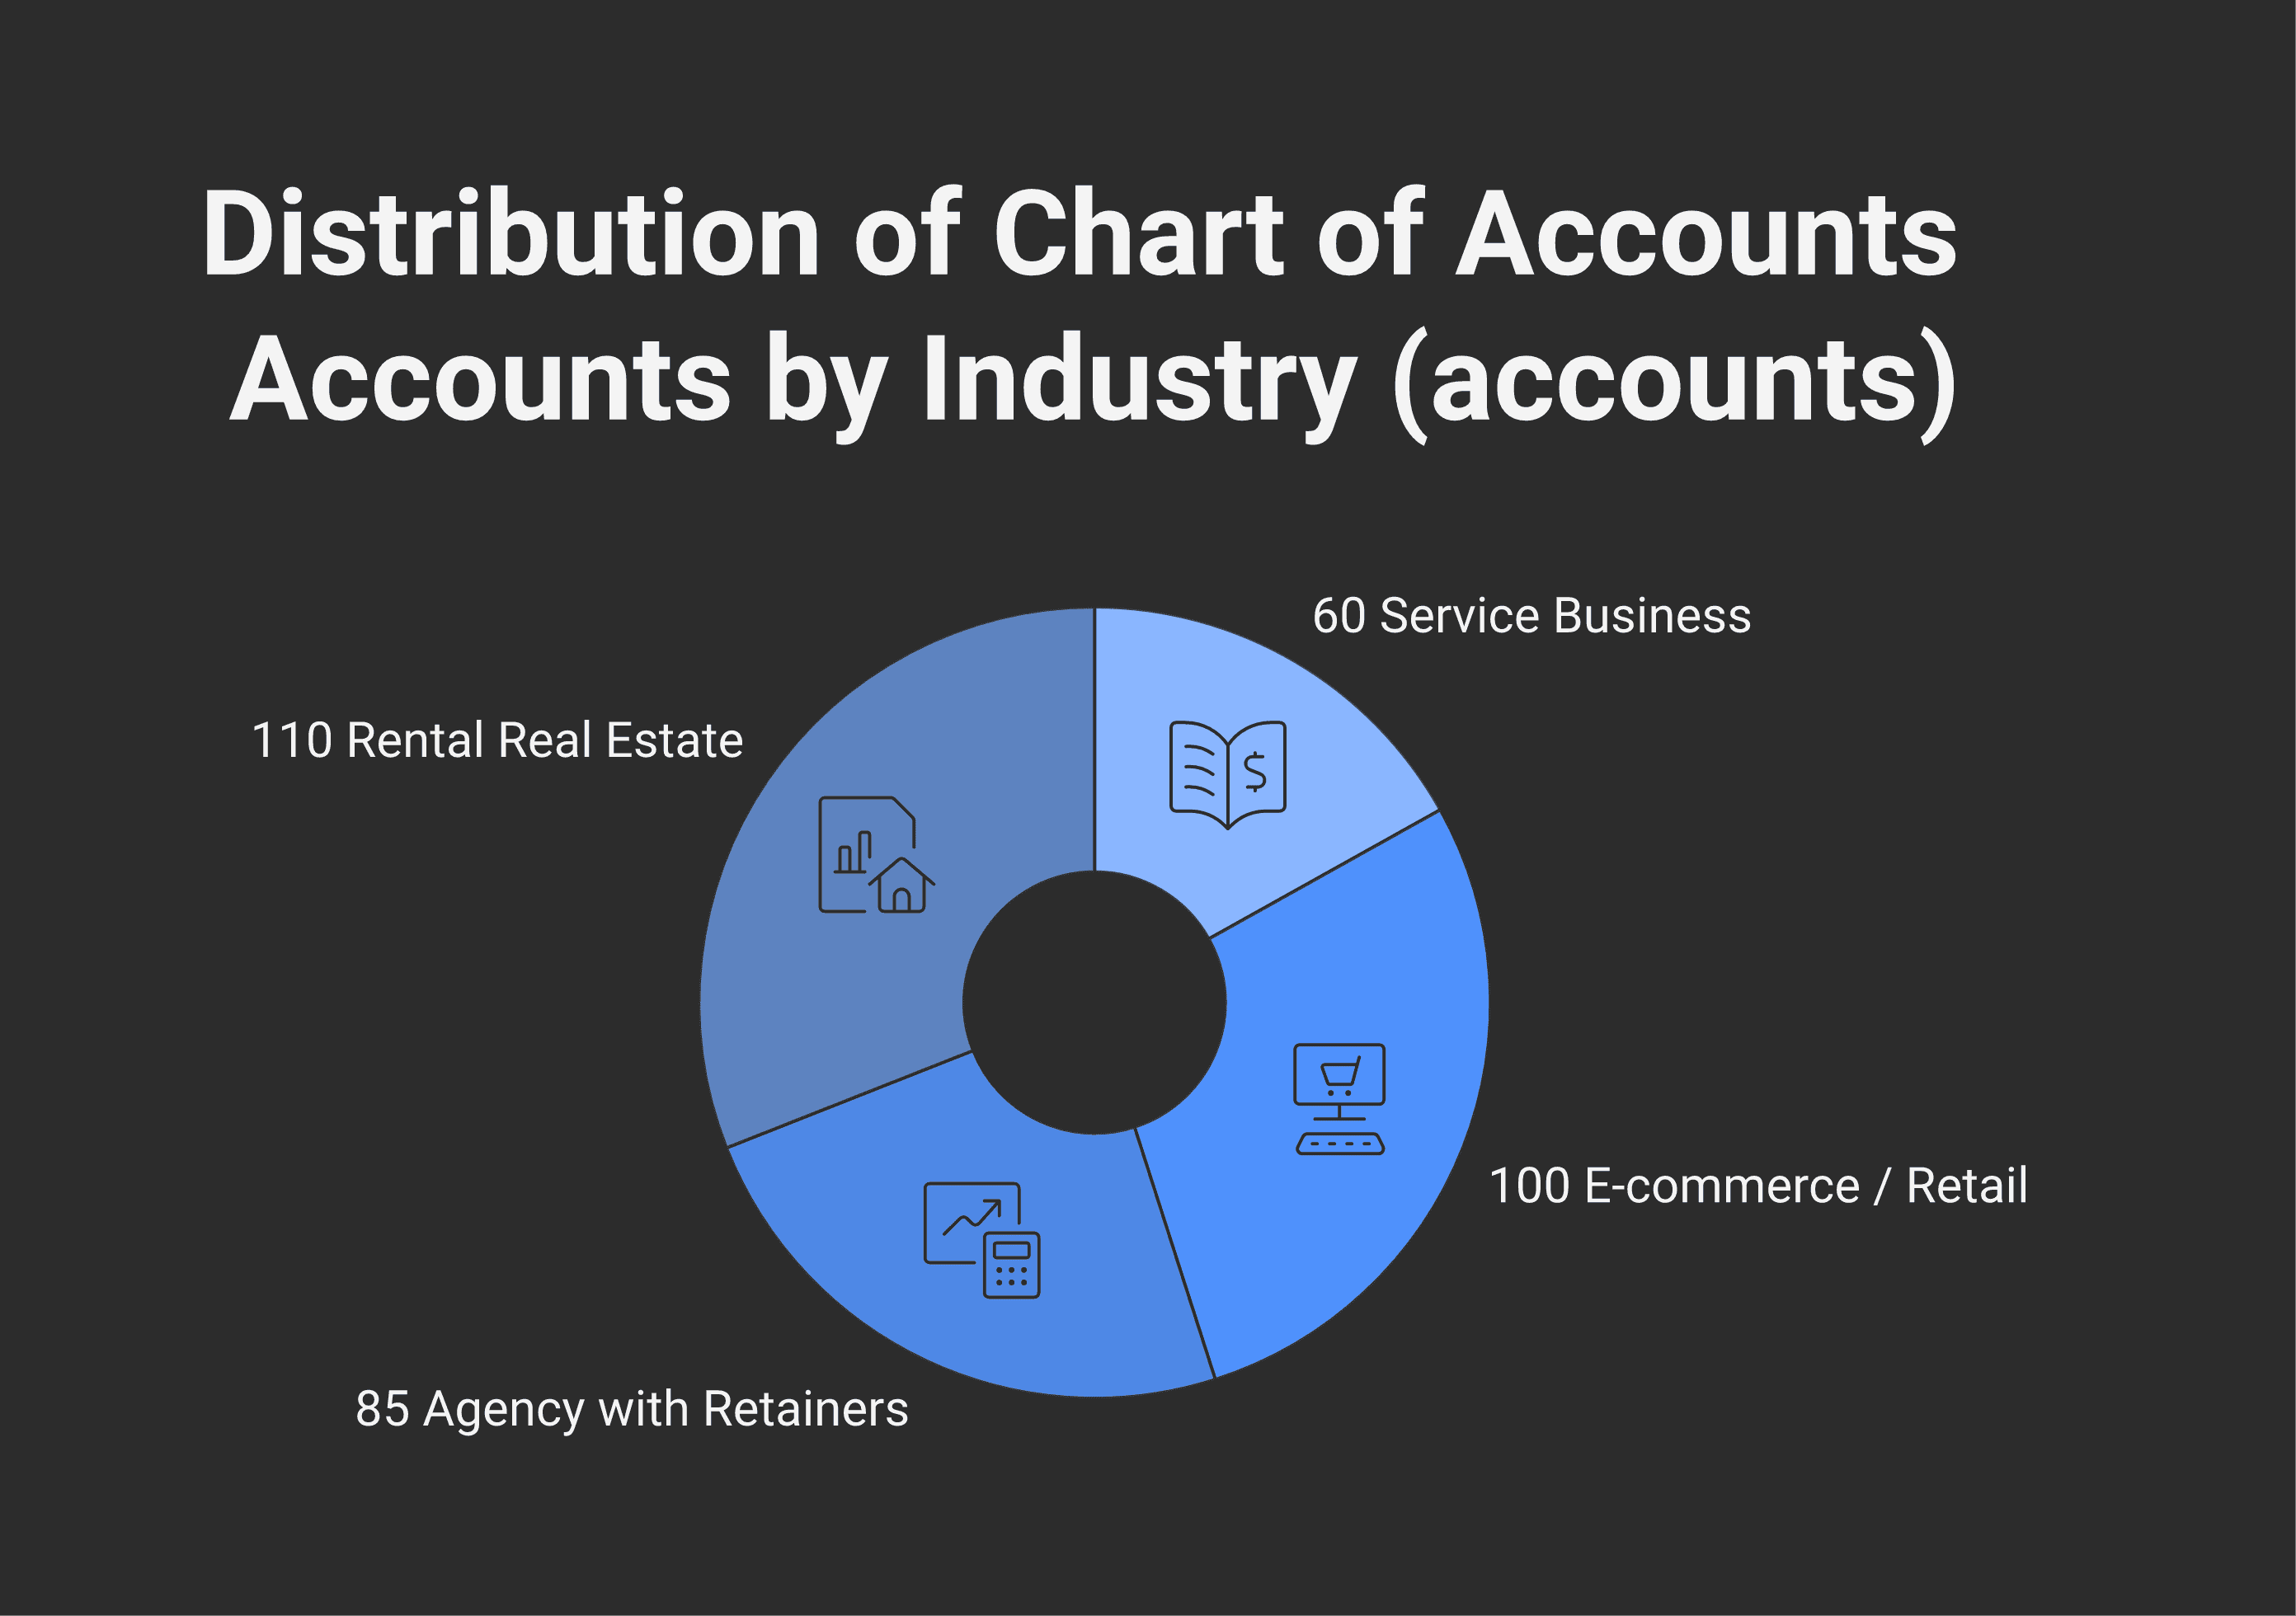
Different businesses want different COAs. A few common patterns:
Service business (consulting, agencies, professional services)
Revenue: one or two lines — "Service revenue" or split by service line (e.g., "Strategy fees", "Implementation fees")
Cost of goods sold: subcontractor expense, direct project costs
Operating expenses: standard categories — rent, utilities, software, professional fees, marketing, travel
Most service businesses can run on 50–70 accounts total
E-commerce / retail
Revenue: split by sales channel (Shopify, Amazon, wholesale) — multi-channel businesses need this split for reconciliation
Cost of goods sold: inventory purchases, freight in, payment processing fees (large enough to deserve its own line in e-com)
Inventory accounts: usually one inventory asset account; the bookkeeper does monthly cost adjustments
Operating expenses: marketing usually splits into "paid ads" and "marketing tools"
Typical COA: 80–120 accounts
Rental property / real estate holding
Revenue: split by property (one revenue account per property is common for single-owner portfolios)
Operating expenses: split by property — property tax, repairs, insurance, property management — each per-property
Asset section: each property as its own fixed-asset account (land + building separated); CCA classes track separately (see the Modern Axis real estate tax guide for how CCA classes flow through to the T1 or T2)
The Modern Axis allowable rental expenses post covers the deduction categories that should each have their own line in a rental COA
Typical COA: 100+ accounts for multi-property portfolios
Agency with retainers
Revenue: split between "fees earned" (P&L) and "deferred revenue" (balance sheet) so retainers flow through correctly
Operating expenses: contractor / freelancer costs are usually large enough for their own COGS line
The chart needs to support project-level reporting if margin per project matters — usually a class or location dimension on top of the account structure
If your business doesn't match these patterns exactly, the principle is the same: structure the COA around what you want to measure.
The "add an account" decision
When the bookkeeper (or the owner) wants to add a new account, three questions to ask first:
Will I want to see this line separately on the P&L? If the answer is "no, I'd just want to know the total for X category", the new account doesn't earn its place.
Will the new account have meaningful volume? If it'll get one transaction a year, it doesn't need to exist. Use the parent category and add a transaction memo.
Does this represent something genuinely new, or is it a vendor variant of an existing category? Adobe, Canva, Zoom, and Figma are all "Software subscriptions". They don't each need their own line.
A discipline: every new account requires a one-sentence reason. If you can't write the reason, don't create the account. This single rule cuts most COA bloat at the source.
Cleaning up an existing COA
If you've inherited a sprawling COA, the cleanup is mechanical but takes time:
Pull a report of every account with its year-to-date activity. Most software has this as "account activity" or "general ledger summary".
Identify accounts with one transaction or zero activity. These are the consolidation candidates.
For each consolidation candidate, decide the parent account it should roll into. Adobe → Software subscriptions. Office supplies — pens → Office supplies.
Reclassify the historical transactions to the parent account. Most software has a "merge" or "make inactive" function — merging moves history; making inactive just hides the account going forward.
Audit the chart structure once consolidated. Are revenue lines telling you what you want to know? Are expense categories at a useful level? Is COGS clearly separated from operating expenses?
A clean COA cleanup typically reduces account count by 30–50% on a DIY-managed business and surfaces a few real categorization errors along the way.
When the COA cleanup lands on a bookkeeper
Modern Books rebuilds the COA on every onboarding — taking the existing chart, mapping it against an industry-appropriate structure, consolidating one-transaction accounts, and producing a chart that's clean enough for monthly reporting and the year-end accountant. Modern Books' Starter and Mid tiers include this as part of onboarding. More bookkeeping posts in the Modern Books resource hub.
Frequently asked questions
What is a chart of accounts in simple terms?
A chart of accounts (COA) is the structured list of every account your business uses to record financial transactions — every revenue line, expense category, asset, liability, and equity item. It's the structure of your financial reporting, not just a configuration in your bookkeeping software. The COA determines what your books can tell you and how detailed your P&L and balance sheet will be.
How many accounts should a small business have?
Most small businesses need 50–100 accounts. Service businesses are at the lower end (50–70), e-commerce and retail closer to 80–120, multi-property real estate holdings often over 100. Too many accounts is the more common failure mode. A 240-account COA with one transaction in half the lines is harder to read than a 60-account COA with the right structure.
What are the main categories in a chart of accounts?
Five top-level categories: Assets (what the business owns), Liabilities (what it owes), Equity (what's left for owners), Revenue (what comes in), and Expenses (what goes out). Expenses are often split into Cost of Goods Sold (directly tied to delivering the product or service) and Operating Expenses (overhead). Every individual account is a sub-account inside one of those five.
Should I use the QuickBooks default chart of accounts?
The default is a reasonable starting point but rarely the right end state. It's industry-generic and tends to be too granular for a true small business. The correct approach: start with the default, then customize for your industry (service vs e-commerce vs agency vs rental), consolidate accounts you won't use separately, and add accounts only when you'd want to see them as their own line on the P&L.
When should I add a new account?
When the new account represents something genuinely new — not just a vendor variant of an existing category — and you'd want to see it separately on the P&L. Adobe and Canva are both "Software subscriptions"; each doesn't need its own account. The discipline: write a one-sentence reason for every new account. If you can't write the reason, don't create the account.
How do I clean up a chart of accounts that's gotten too granular?
Pull a year-to-date activity report for every account. Identify accounts with one transaction or zero activity — these are consolidation candidates. For each, decide the parent account it should roll into, then reclassify the historical transactions. Most bookkeeping software has a "merge" function. A typical DIY-managed COA loses 30–50% of its account count in a proper cleanup with no loss of useful information.
Do industries have different chart of accounts standards?
Yes, in structure but not in the underlying categories. Service businesses keep revenue simple (one or two lines); e-commerce splits revenue by sales channel; rental real estate splits revenue and expenses by property; agencies need deferred revenue for retainers. The five top-level categories are universal; the sub-account structure is industry-specific. Generic templates rarely fit a specific business cleanly.
What's the relationship between the chart of accounts and the balance sheet / P&L?
The COA defines the structure of both. Asset, liability, and equity accounts appear on the balance sheet (point-in-time snapshot). Revenue and expense accounts appear on the P&L (period summary). When you look at a P&L line that says "Software subscriptions $4,800", that's the year-to-date total of every transaction recorded to that one COA account. The COA dictates which transactions get summarized together and which stay separate.
This post covers general bookkeeping practice in Canada and isn't bookkeeping advice for your business. The right COA structure depends on your industry, your reporting needs, and the systems you use. Talk to a bookkeeper who knows your numbers before restructuring a chart of accounts that's been running for years.